Network Design & Site Selection
Leverage data to optimize your network.
Built to help supply chain leaders make decisions
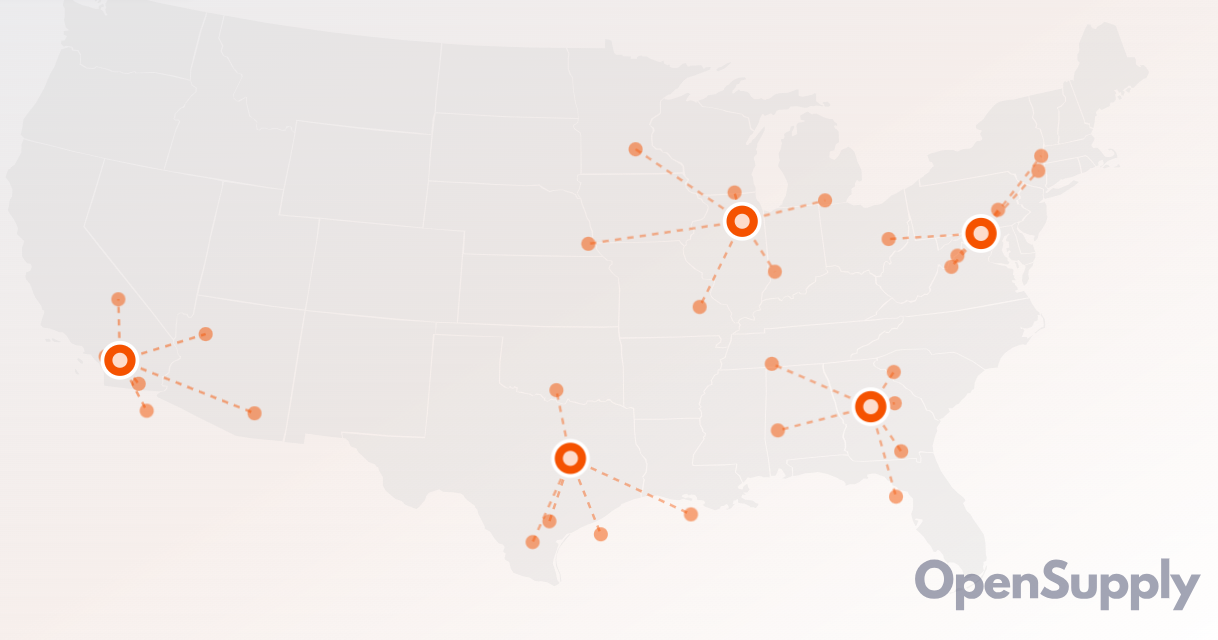
The Optum Group empowers you to visualize your entire network - inbound, outbound, and everything in between. By blending data and industry expertise, we help organizations move from guesswork to precision.
Network Modeling
Identify optimal DC locations, simulate service levels, and model transportation cost trade-offs.
Output: heat maps, flow diagrams, cost vs. speed graphs
Site Selection & 3PL Analysis
Evaluate optimal facility locations and analyze 3PL partnerships to maximize service levels while minimizing costs.
Output: site scoring matrices, 3PL comparison reports
3PL Partner Matching
Tap into Optum's 3PL database to match operational needs with qualified logistics partners.
Output: curated shortlists by region and capability
Output is purely directional and network decisions should only be made after a complete review of data